El Niño is the warm phase of ENSO, i.e. related changes of the ocean and atmosphere over the equatorial Pacific. It appears irregularly, usually at intervals of 2–7 years, and can change rainfall patterns, temperatures and conditions for nature. The term “super El Niño” refers to an exceptionally strong episode. However, El Niño alone is not enough to predict winter in Poland or the weather during a specific holiday.
Question
Answer
Where does it form?
In the central and eastern part of the equatorial Pacific.
How long does it last?
Most often around 9–12 months; some episodes last longer.
What does it change?
Ocean conditions, atmospheric circulation, and the probability of certain weather in different regions.
Does it determine the weather in Poland?
No. The relationship is indirect, depending on the season and other circulation elements.
Where to find current data?
In the announcements of NOAA CPC, WMO and the meteorological service of the country you are traveling to.
When headlines about El Niño return, it’s easy to feel like a new phenomenon is coming. Meanwhile, fishermen off the coast of Peru knew its traces long before the age of satellites: the ocean was getting warmer and the fishing was declining. Today we know that a local change may be caused by a process covering much of the Pacific Ocean and affecting the weather even far away. [4]
For a traveler, this has a very specific meaning. When traveling to Indonesia, there is a question about the rainy season, in the Galapagos about conditions for animals, and before a vacation in the Caribbean about hurricanes. Each of these questions requires looking at a different region and time of year. One red map of the ocean does not provide all the answers.
This guide explains where El Niño comes from, how it differs from La Niña, and why the word “super” needs some clarification. You will also find the history of the phenomenon, some surprising natural observations and tips on how to use forecasts when planning a trip. Current measurements and forecast are separated by a dated section about the current El Niño, which you can return to before your trip.
El Niño is a persistent warming of the surface of the central and eastern equatorial Pacific accompanied by changes in the atmosphere. It belongs to a larger system called ENSO El Niño–Southern Oscillation. In Polish we talk about El Niño and the Southern Oscillation. In addition to the warm phase, we distinguish cold La Niña and a neutral state. [1]
It’s not about a single hot day at the seaside. Oceanographers check the large area, the deviation of temperature from the value typical for a given period and the durability of the change. Meteorologists simultaneously observe wind, pressure and cloud distribution. Only such a combination shows whether the ocean and atmosphere have started to support El Niño together. [2]
This scale distinguishes it from a local marine heat wave. Meanwhile, coastal El Niño, monitored in Peru, describes warming closer to the coasts of Ecuador and Peru. It may be of great importance to residents, but its index should not be equated with a measurement in the middle part of the ocean. Therefore, the messages from the Peruvian ENFEN and the American NOAA may describe different aspects of the situation in the Pacific. [25]
How does El Niño form? From trade winds to rain
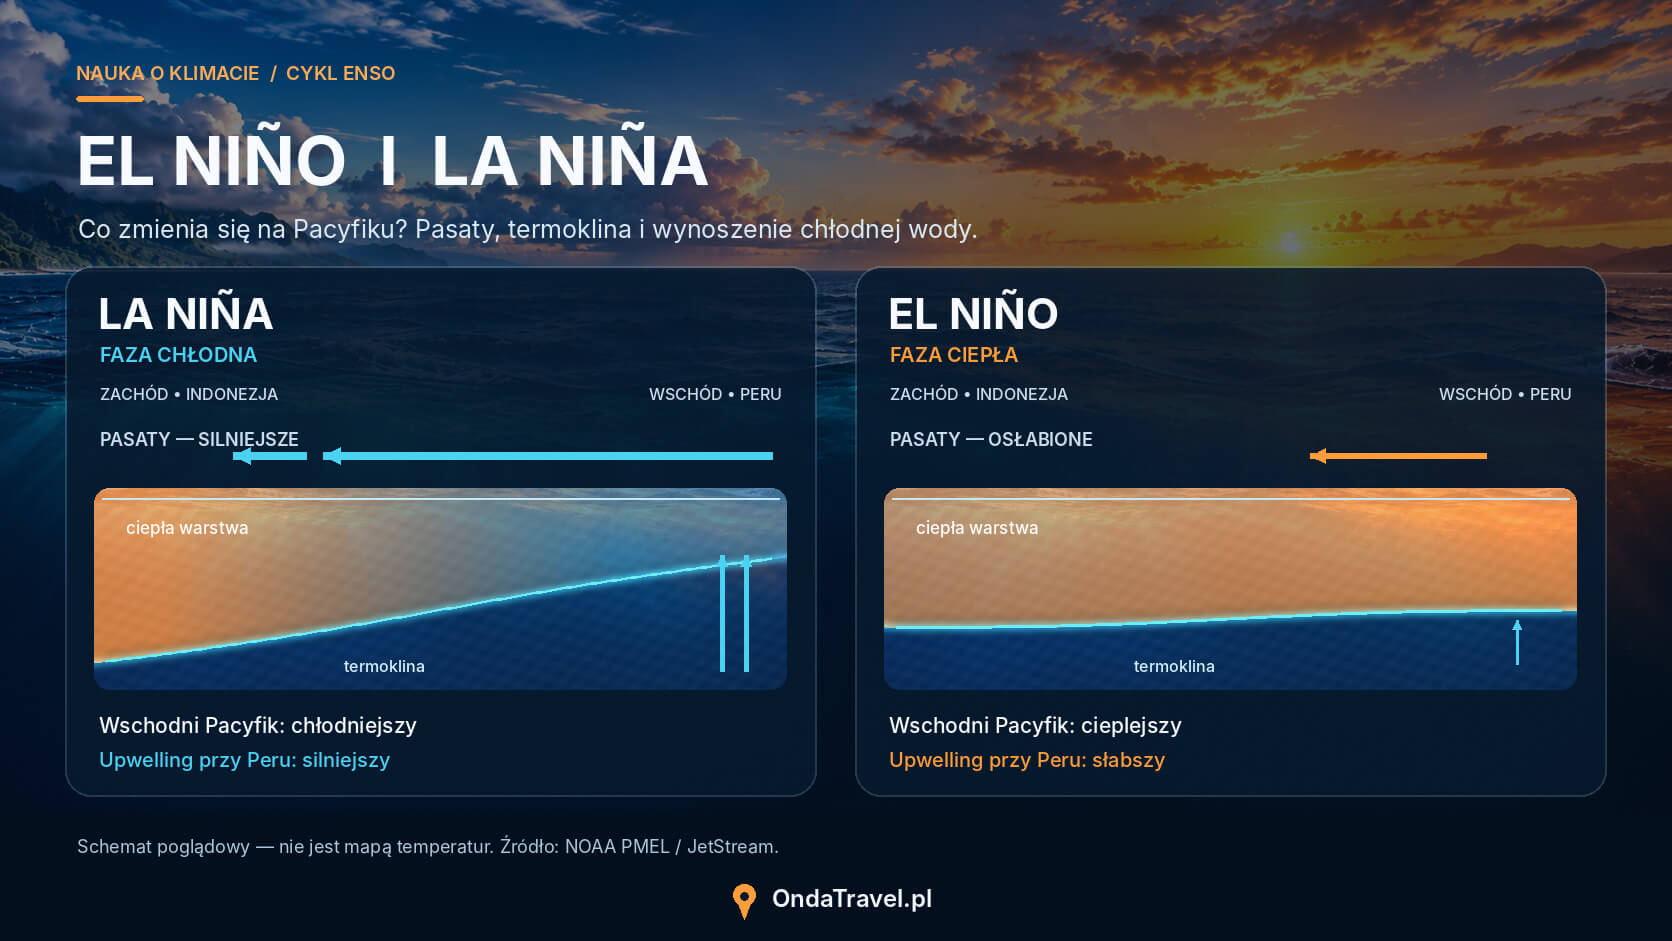
Under typical conditions, trade winds blow across the equatorial Pacific from east to west. They help collect warm water on the Indonesian side, where moist air rises and encourages the development of rain clouds. In the east, closer to South America, cooler water from deeper layers reaches the surface more easily. This process is called upwelling. [2]
The ocean then does not resemble a perfectly even bathtub. The warm layer is thicker in the west, and the thermocline – a zone where temperature drops rapidly with depth – is sloping. During El Niño, trade winds weaken, warm water expands eastward, and the thermocline becomes less tilted. The eastern part of the ocean has more difficult access to cool water from the depths. [3]
An area of strong evaporation and precipitation moves behind the warm water. This changes the atmosphere heating system and with it the circulation. The ocean therefore influences the wind, which in turn maintains changes in the ocean. This feedback explains why El Niño can develop for many months. [5]
Kelvin waves also participate in transmitting changes across the Pacific. They don’t look like a big wave crashing on the beach. They are extensive disorders, including: sea level and the location of the thermocline. They can move along the equator to the east, and after reaching America, also along its coast. [23]
El Niño and La Niña: differences and cycle length
El Niño and La Niña are two phases of the same system. During La Niña, trade winds tend to strengthen and the surface of the central and eastern equatorial Pacific is cooler than average. In parts of the tropics, the weather trends associated with it are similar to the reverse of those of El Niño. However, this does not mean that every storm, drought or rainy season is a mirror image. [13]
Feature
El Niño
La Niña
Neutral condition
Temperature of the Pacific area studied
Higher than typical
Lower than typical
Closer to typical values
Trade winds
Usually weaker
Usually stronger
Without a permanent signal of one of the phases
Duration
Most often 9–12 months; sometimes longer
It may last longer than a year, sometimes several years
Variable
The entire cycle is irregular. An interval of 2–7 years describes typical ENSO behavior, not a timetable. El Niño does not have to end immediately with a transition to La Niña. There are also longer neutral periods. Many episodes reach their greatest intensity near winter in the Northern Hemisphere, although regional effects have their own calendar. [1][13]
A neutral state does not mean calm weather around the world. Heatwaves, cyclones and floods continue to occur; ENSO simply does not give such a clear signal to one of its extreme phases. When planning a trip, you should check local conditions also in years when there is almost no mention of El Niño. [11]
Diagram comparing trade winds, thermocline and upwelling during El Niño and La Niña.
The story of El Niño: from Peruvian fishermen to satellites
Name El Niño means boy or baby in Spanish. In this case, it is associated with Christmas: fishermen and sailors off the coast of Peru noticed warm water around this time of year. Initially, the name referred to a coastal phenomenon. Over time, it came to be used to describe extensive episodes of Pacific warming. It does not follow that each episode begins exactly in December. [4]
An important clue came from a completely different part of the world. In the 1920s, Gilbert Walker investigated relationships that could help predict the strength of the Indian monsoon. He noticed connections between pressure changes between distant regions and described the Southern Oscillation. In the 1960s, Jacob Bjerknes linked changes in Pacific temperature to the behavior of the atmosphere. Today’s concept of ENSO combines these oceanic and atmospheric observations. [5]
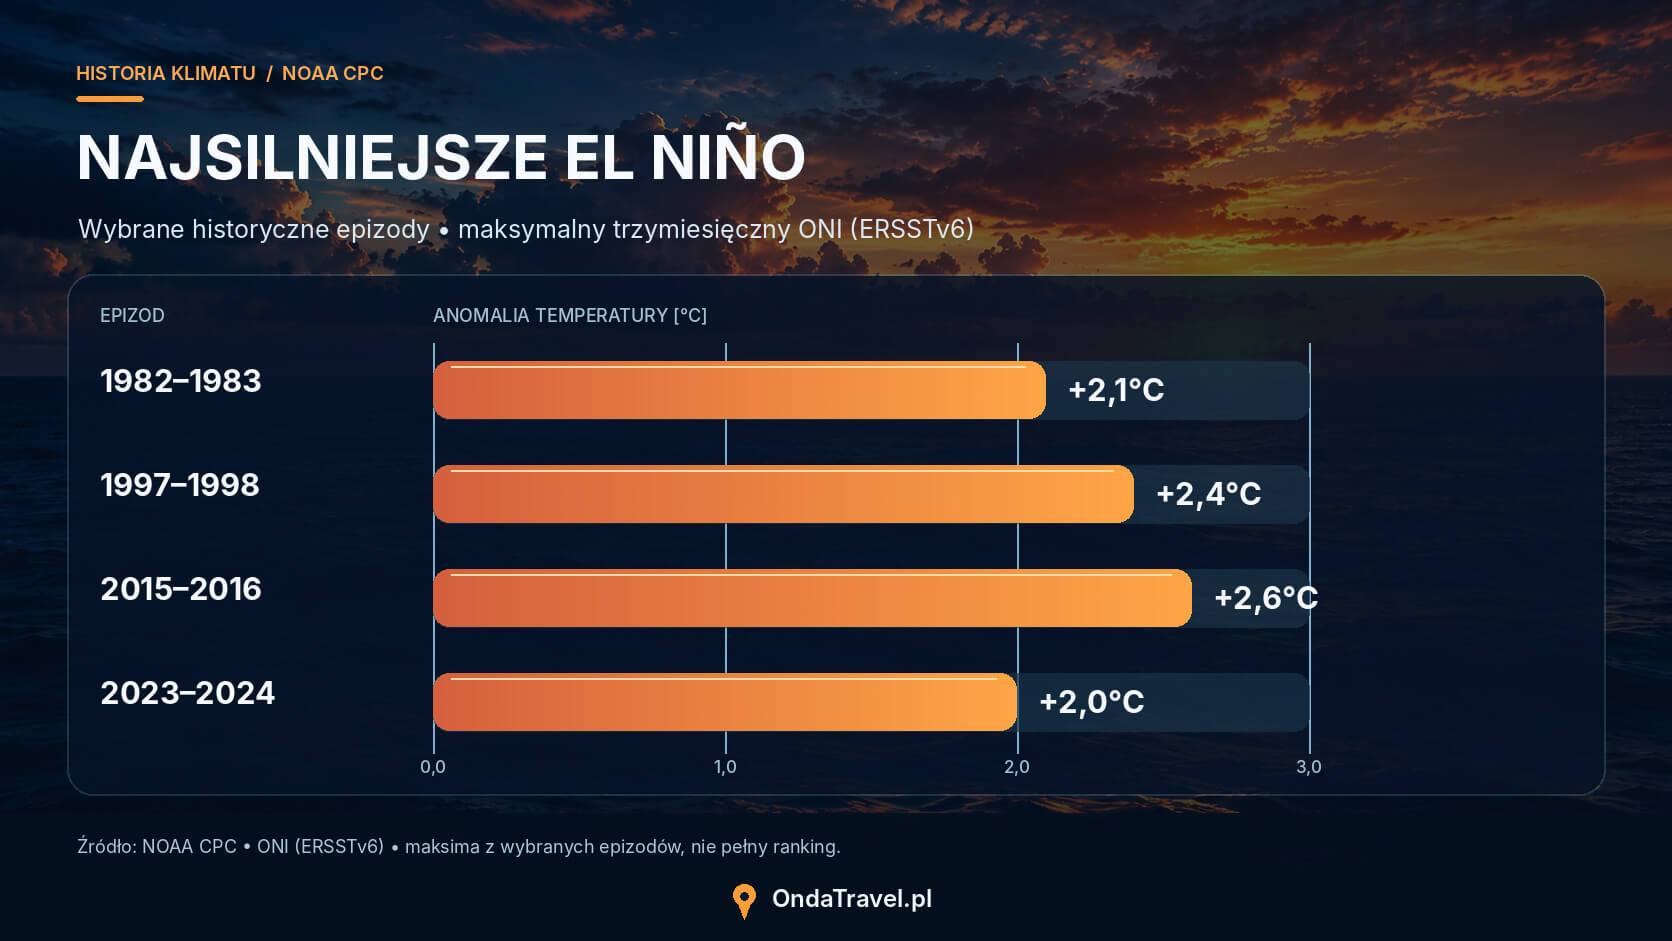
Modern monitoring uses buoys, satellite measurements and models of the ocean and atmosphere. History is used for comparison, but it does not provide a ready script for the next episode. The El Niños of 1982–1983, 1997–1998 and 2015–2016 are particularly often mentioned. When comparing their strengths, you first need to determine which index we are using. ONI and RONI compare the temperature with a reference value, with RONI additionally taking into account the warmer background of the tropical oceans. [13][6][7]
Episode
Peak ONI
Peak RONI
1982–1983
+2.1°C
+2.4°C
1997–1998
+2.4°C
+2.3°C
2015–2016
+2.6°C
+2.3°C
2023–2024
+2.0°C
+1.4°C
Comparison of three-month maximums in ERSSTv6-based NOAA CPC tables, reviewed October 17, 2026. The maximums of the two indexes do not have to fall in an identical window. These are temperature variations, not ocean temperature. Older publications may report different values from earlier versions of the data. [6][7]
The difference seen in the 2023-2024 episode is a good indication: the term “strongest on record” sometimes depends on how it is measured. Pacific temperatures should also not be used as a simple loss ranking. The scale of damage is determined by, among others: location of rainfall, condition of infrastructure and preparedness of residents.
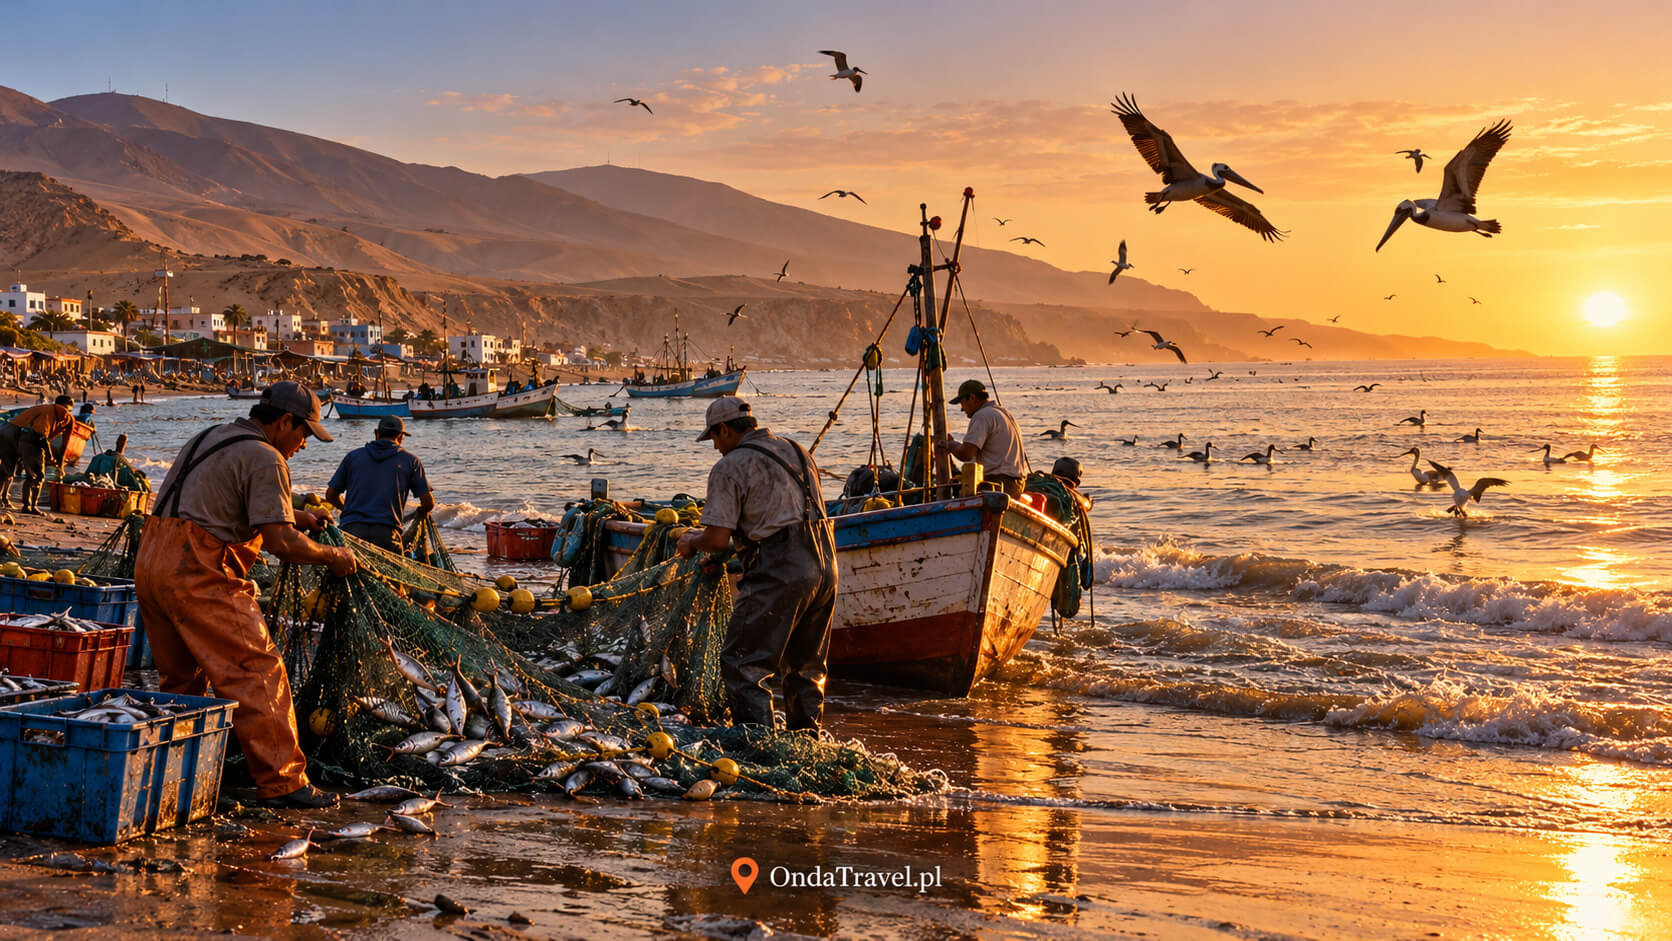
Peruvian fishing is historically associated with the name El Niño. Illustration, not documentation of a specific episode.
What is a super El Niño and how is its strength measured?
“Super El Niño” is a popular term for an exceptionally strong episode, not a separate climate phase. WMO does not use this name as an operational category. Therefore, it is worth asking what threshold, region and measurement period the author of the headline has in mind. In the NOAA CPC strength classification, the “very strong” category starts with an index value of +2.0°C. [11][8]
The most common label is Niño 3.4. It is an imaginary rectangle in the ocean between 5°N and 5°S and 170°W and 120°W. Researchers average the sea surface temperature there. The area is large enough to allow observing the development of ENSO, not just the weather at one point. [6]
ONI describes the three-month temperature deviation of this region from the reference value. RONI, i.e. the relative index, additionally takes into account the temperature background of tropical oceans. To put it simply, it asks how much the studied part of the Pacific stands out from the already warm tropics. NOAA CPC transitioned to RONI for operational ENSO monitoring on February 1, 2026; the older ONI is still published and used in comparisons. [7][9][10]
In NOAA’s historical classification, an El Niño episode requires a RONI value of at least +0.5°C for a minimum of five consecutive, overlapping three-month seasons. Five such windows do not mean fifteen separate months: January-March and February-April have two months in common. The reaction of the atmosphere is also important in the current diagnosis. Just temporarily crossing the threshold does not describe the entire phenomenon. [6]
Value in the message
What does it mean?
What to compare it with?
Daily sea temperature
Temperature averaged for one day and area
With the same daily series and the same region
Weekly Niño anomaly 3.4
Shorter deviation measurement; it can be traditional or relative
With the same anomaly definition and weekly window
ONI or RONI
Index based on three-month average
With a history of the same index and data version
Daily ocean temperature, deviation from normal, and index forecast answer various questions. The report of exceptionally warm water may be true, although the final strength of the episode remains unknown. The comparison makes sense when both numbers describe the same area, period and indicator.
Plot of maximum ONI values of selected historical El Niño episodes.
The effects of El Niño in the world: where is it drier and where is it wetter?
The impact of El Niño is like changing the odds for a certain season to unfold. The signal can be strong, but it does not work equally everywhere. The location of the warmest water, the time of year and other phenomena such as the Indian Ocean dipole are important. Therefore, the typical effects map is a starting point; before leaving, it is worth replacing it with the current regional forecast. [11]
Region
Typical trend during El Niño
Importance for travel
Coast of Peru and Ecuador
Warmer water; in parts of the region there is a greater risk of heavy rainfall
Check the forecast for a specific stretch of coast and commute.
Indonesia and part of island Southeast Asia
More often, conditions favor rainfall deficiency
Watch for the start of the rainy season, fire reports and air quality.
Central and eastern Australia
There is often less rainfall during the local winter and spring
Take into account local heat, entry bans and fire hazards.
Part of East Africa
More frequent rainfall during the short rain season, from October to December
Check the route availability and forecast for your safari or trekking destination.
South Africa
Parts of the region are more likely to have a lack of rainfall during their summer rainy season
On a longer route, pay attention to local water supplies and park conditions.
Atlantic and Caribbean
El Niño may limit conditions favorable to hurricanes on a seasonal basis
An isolated severe cyclone is still possible; check announcements for your major.
The table shows climate trends, not a forecast for a specific date. Basis: WMO, NOAA and Australian Bureau of Meteorology. [11][12][13][14]
Australia shows well why a season needs to be added. El Niño is clearly related to lower rainfall in parts of the country during winter and spring, but it does not guarantee a dry summer across the continent. The situation is also influenced by the Indian Ocean and weather systems developing closer to Australia. [12]
Similar caution is needed in the Caribbean. Wind changes at different altitudes can hinder the development of hurricanes over the Atlantic. However, the forecast for a less active season describes the entire basin. It doesn’t say that a particular island will miss the path of one of the storms. [14]
In Asia, it is not worth reducing the plan to the sentence “El Niño means no rain.” Indonesia, northern Thailand and the coast of Vietnam have different seasonal patterns. The choice of month, island and coast still requires local verification. The forecast for a large region helps assess the background, but does not replace information about where to stay overnight.
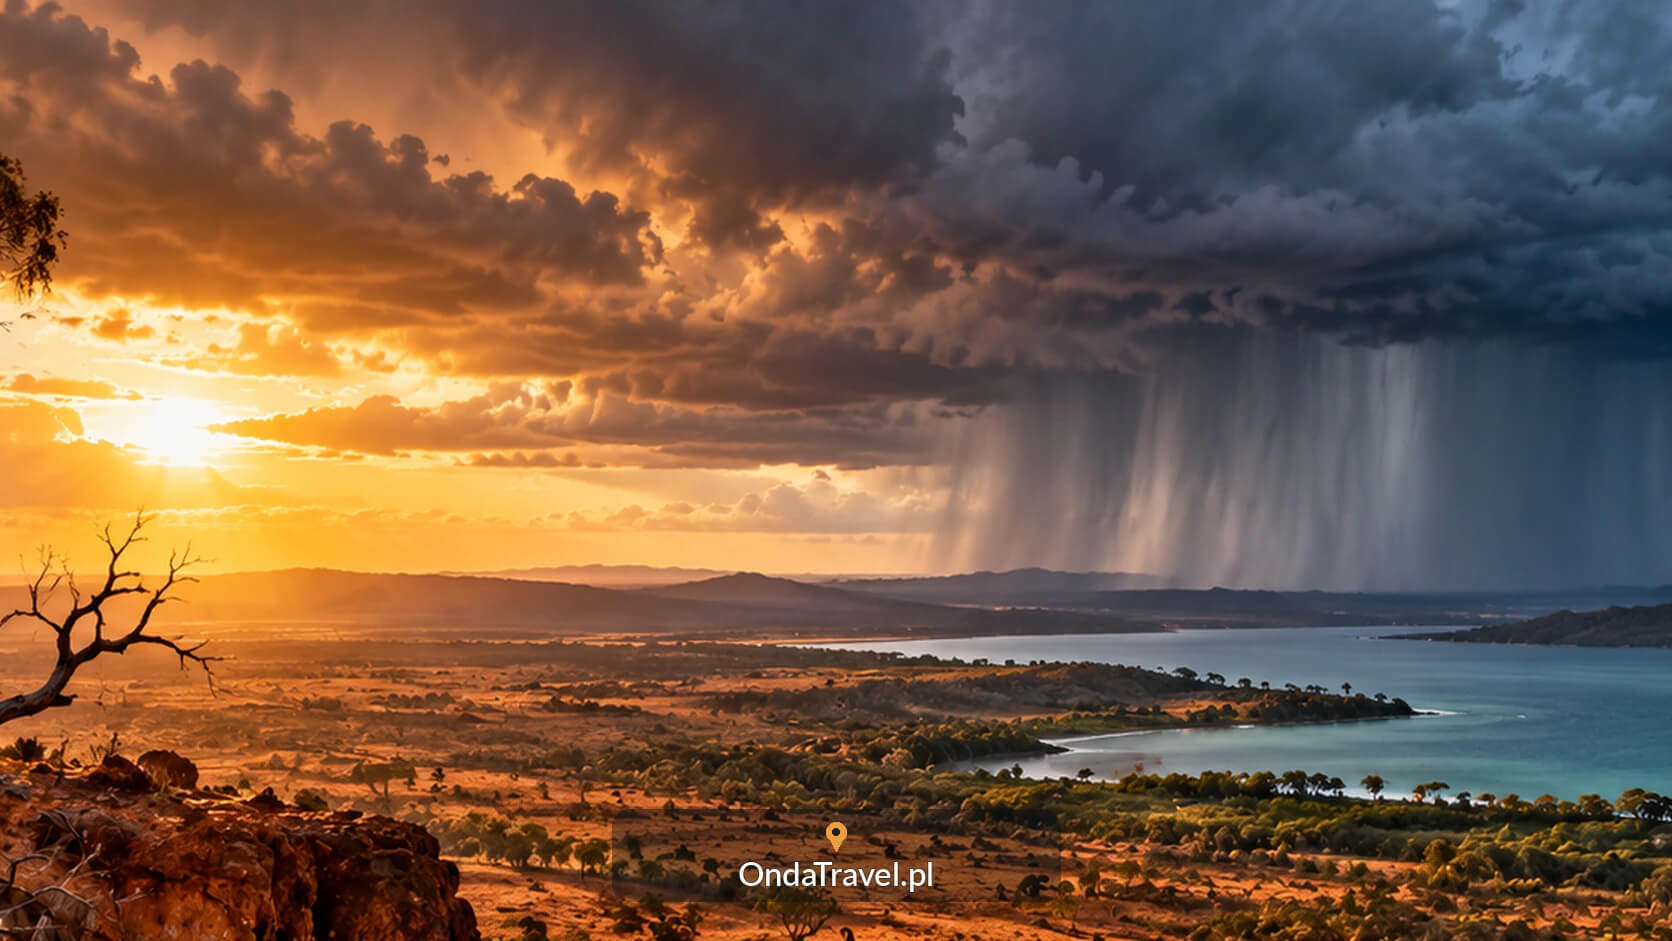
Australian landscape. El Niño may increase the likelihood of rainfall deficits in parts of the country and seasons.
El Niño in Poland: can it predict winter?
El Niño alone does not allow us to reliably predict whether the Polish winter will be frosty, snowy or exceptionally mild. The signal from the tropical Pacific can reach the Atlantic region and Europe through changes in atmospheric circulation. However, it is indirect and its course depends, among others, on: from part of the season. [15]
Research on the impact of ENSO on Europe shows that the beginning and later part of winter may respond differently. Pressure systems over the Atlantic, the North Atlantic Oscillation and the state of the stratosphere are of great importance. A headline that derives a snow forecast for Warsaw from a single Pacific index ignores this complexity. [15]
In practice, it is worth separating three questions. The ENSO forecast describes the development of the phenomenon in the following months. A seasonal forecast evaluates the likelihood of variations in temperature or precipitation in a given region. Only the weather forecast for a specific place approximates the conditions during the weekend or a trip to the mountains.
When the date of the trip is close, consult the live storm and precipitation radar. It helps check the situation in the immediate area, while El Niño describes a much slower climate process.
GUIDE
Where is the storm?
Check the storm and rainfall radar before heading out.
El Niño and nature: the ocean can change more than the weather
Warmer water may seem good news to tourists, but for marine organisms it means a change in living conditions. A weaker supply of nutrients from the depths affects food production at the base of the marine dependency network. Effects may be seen later in the behavior, reproduction and survival of larger animals. In the Galapagos they are observed by, among others: Charles Darwin Foundation. [26]
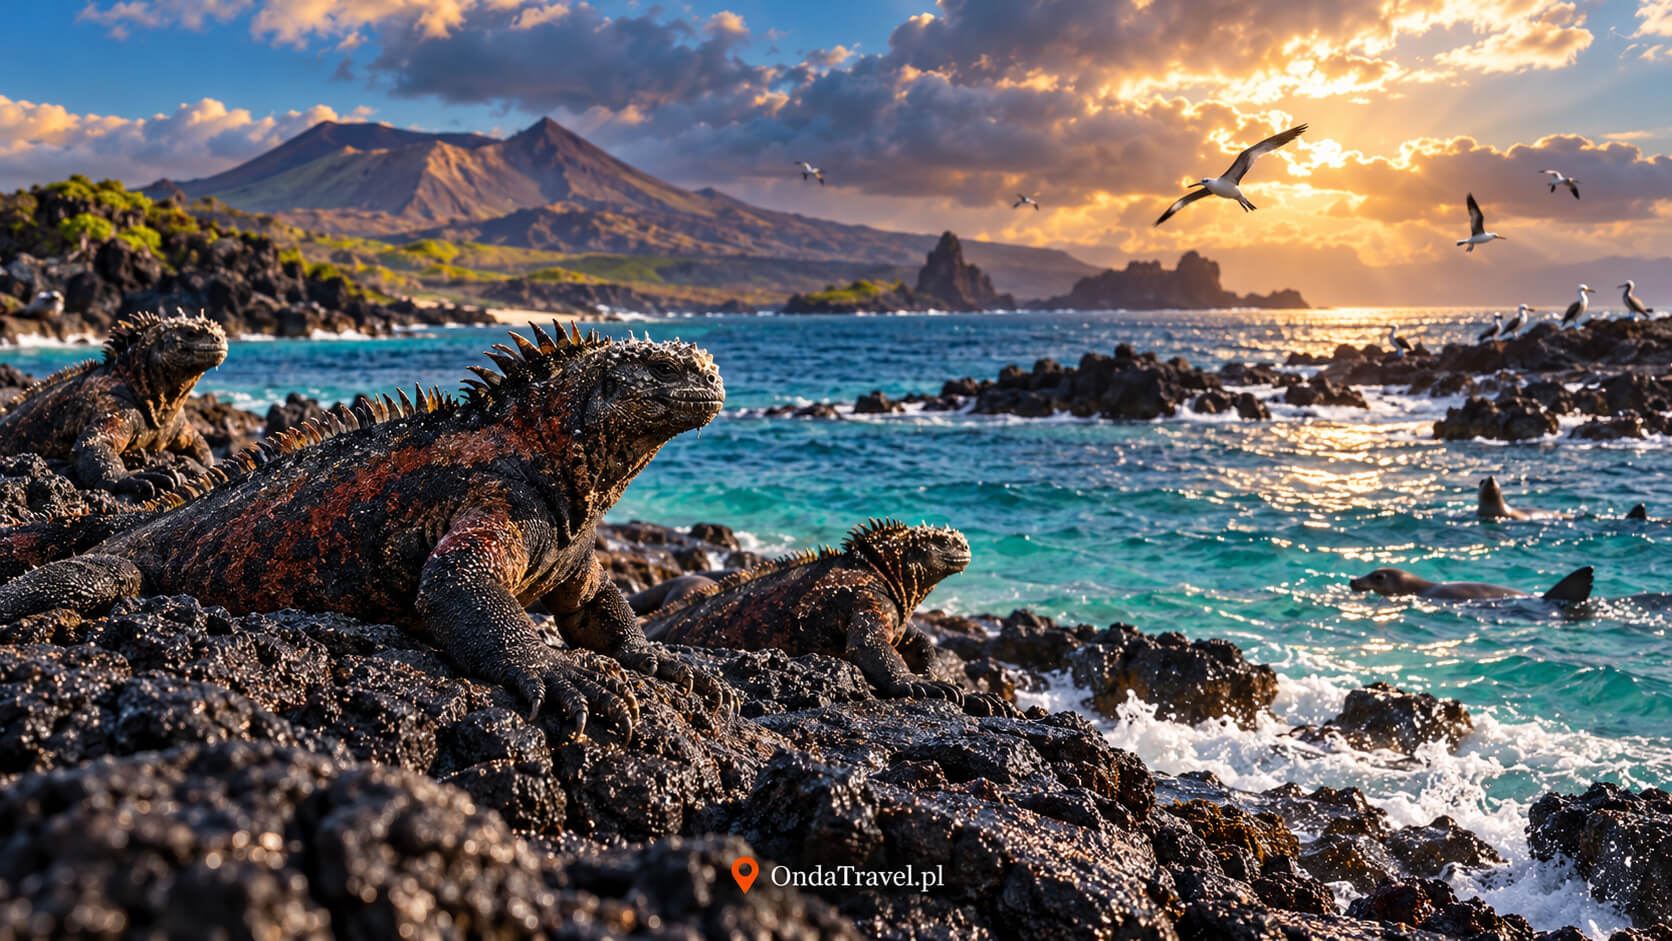
Marine iguanas may be shrinking. Martin Wikelski and Corinna Thom described in Nature the ability of adult Galapagos iguanas to reversibly reduce body length due to food shortages during El Niño. It’s about something more surprising than simple weight loss. The study shows how intense pressure can be exerted by changing ocean conditions. [16]
The change can be seen in the color of the sea. Less phytoplankton means less chlorophyll, and this can change the signal recorded by satellites observing the color of the ocean. In a description of the October 2026 observations, NASA pointed to bluer water in the equatorial Pacific and a link to a limited supply of nutrients. A photo with a beautiful turquoise color is therefore not a simple measure of the good condition of the ecosystem. [17]
Bleached coral does not have to be dead. Under heat stress, it may lose the symbiotic algae living in its tissues. If conditions improve, recovery is possible; long-term stress increases the risk of death. El Niño can add heat to already high ocean temperatures, but not every bleaching event is solely due to ENSO. [18]
When taking a nature cruise, it is better to ask the local operator about current observations and applicable rules than to expect that photos from the previous season will be repeated during our trip. A change in animal behavior does not automatically mean that they will disappear from the entire archipelago. This cannot be inferred from the name El Niño alone.
Marine iguanas on the black rocks of the Galápagos Islands.
El Niño and climate change: what is a cycle and what is permanent warming?
El Niño is part of natural climate variability, and current global warming is changing the backdrop against which this cycle operates. This distinction is needed when comparing temperatures from different decades. Even a similar ENSO episode could develop today in a warmer ocean and atmosphere. This is why researchers also use the relative RONI index. [10]
During El Niño, heat exchange between the ocean and the atmosphere changes. Warmer water promotes evaporation, and the condensation of steam as clouds form releases heat into the air. The effect on global average temperature lags behind changes in the Pacific. La Niña may work in the opposite direction, but it does not remove the long-term warming associated with greenhouse gas emissions. [28]
It is impossible to reduce the future of ENSO to the certainty that each next El Niño will be stronger. The results depend on the period, indicator and emission scenario examined. A study published in Nature Climate Change in 2022 shows an increase in ENSO-related temperature variability in the 21st century under the analyzed scenarios. This is a result of climate statistics, not a forecast of the sequence of specific episodes. [20]
The IPCC, in turn, estimates that in the second half of the 21st century, under moderate and high emissions scenarios, an increase in ENSO-related rainfall variability is very likely. Changes in ocean temperature and changes in precipitation are not the same measurement. In a warmer world, impacts on humans may also increase while the cycle itself remains complex and irregular. [19]
What is known about the current El Niño?
Information status: October 17, 2026 This fragment contains data about the current episode. The remaining parts of the guide explain the mechanism and typical relationships that can also be used in subsequent years.
In an October 8 announcement, NOAA CPC assessed the probability of the three-month RONI reaching a value of at least +2.5°C in October-December 2026 at 83%. This would be higher than the previous highs in this series since 1950. This is a forecast; the +2.5°C threshold does not constitute the definition of every “super El Niño”. [21]
You can track the daily sea surface temperature separately. In the NOAA OISST v2.1 series provided by Climate Reanalyzer, the region’s average Niño 3.4 was approximately 30.06°C — the highest in the analyzed series starting in September 1981. The reading was still marked as provisional when checked on October 17. Applies to one region and day; it does not prove a Pacific-wide temperature record or the final strength of the episode. [22]
What about the “other arm” described in the media? This is a pictorial description of the warm water system on the map, not the name of the new ENSO phase. Onet’s article from October 16 refers to such a description, but the shape of the colored area alone does not determine the mechanism of its creation. Kelvin waves are a known feature of changes in the Pacific Ocean; however, assigning them a specific part of the map requires dates, scale and data analysis. [24][23]
You will find the latest announcement on the website NOAA CPC ENSO Diagnostic Discussion. When reading later published data, note whether it is an observation or a forecast, and whether they use ONI, RONI, or a shorter weekly anomaly.
How to take El Niño into account when planning a trip?
El Niño is a useful signal to check your departure more closely. However, information about its development alone is usually not enough to eliminate the entire country. A well-formed plan combines the climate of the place, the seasonal forecast and conditions that will only be known just before the trip.
Start with the location and month. Write down the coast, island or region, not just the name of the country. Check if the date falls during the rainy season, dry season or cyclone season.
Check your regional seasonal forecast. For Australia it will be Bureau of Meteorology, for Indonesia BMKG season forecasts, and for the Peruvian coast ENFEN messages. Look for information for the period in which you are actually traveling.
Translate risk into a plan. If the messages concern heavy rainfall, check the route’s dependence on roads and crossings. In hot or smokey weather, plan an alternative to all-day outdoor activity.
Go back to checking before you go. The weather forecast, warnings from local services and a message from the park or carrier are then of greater value than an article describing a typical El Niño.
This is a practical method of reading information, not a risk forecast for each trip. If the seasonal advisory says there is a higher chance of above normal rainfall, it does not mean a specific number of rainy days. The same monthly total may occur with frequent showers or several intense events.
In Thailand, start by choosing a coast or region; in Vietnam, check conditions in the north, centre and south separately. These guides can help you choose a place and route.
If you are primarily looking for a break from the high temperature, you may want to consider coolcation: holidays in a cooler climate. It’s a choice of travel style; it’s still worth checking rain, wind and local conditions rather than assuming that colder always means easier.
GUIDE
Coolcation: holidays without the heat
Discover ideas for travel in a cooler climate and choose a destination that matches your comfort.
This is the warm phase of the ENSO system. The surface of the central and eastern equatorial Pacific is warmer than usual for an extended period of time, and wind, clouds and precipitation are changing with the ocean. The effects could reach far beyond the Pacific.
How often does El Niño occur?
The ENSO cycle is irregular; El Niño events commonly occur about every 2–7 years. That range cannot be used to place the next event on a calendar; follow ocean observations and seasonal forecasts instead.
How long does El Niño last?
Most often around 9-12 months, although some episodes last longer. Effects in particular regions may come and go at different times than the ocean temperature signal itself.
What is the difference between El Niño and La Niña?
El Niño is the warm phase and La Niña is the cool phase of ENSO. During El Niño, trade winds tend to weaken, and during La Niña they strengthen. Weather trends in some regions may be opposite, but they are not an exact mirror image.
What does Super El Niño mean?
This is the common name for an exceptionally strong episode, not a separate ENSO phase or a formal WMO category. A reliable description should include the index used, the threshold and the measurement period. This term does not prejudge the scale of the effects in a specific country.
Does El Niño mean a cold winter in Poland?
This cannot be inferred from El Niño alone. Its impact on Europe is indirect and depends on the season and other circulation elements. ENSO forecasts should not be treated as temperature and snow forecasts for a Polish town.
Do you have to cancel your vacation during El Niño?
The name of the phenomenon itself is not sufficient to make such a decision. Check the date, region, current forecast and local warnings. Base your decision to change your plan on the conditions regarding your route, transport and activities.
Where to check the current El Niño?
The development of ENSO is described by the NOAA Climate Prediction Center and WMO. For travel, you also need forecasts from national weather services. Always check the announcement date, region, indicator and whether the number provided is a measurement or a forecast.
Sources
Expand the full list of sources and methodology
Sources and data checked October 17, 2026. The section on the current episode distinguishes measurements from forecasts. The historical table uses one version of NOAA CPC data. Links to websites updated after this date may show a newer message.
If this guide helped you understand the forecast before your trip, you can support further OndaTravel content, by buying me a coffee.
Author
Krystian „dziadzia przewodnik”
The North is my greatest passion, but the world is too beautiful to stay in one climate. On my blog I combine the raw nature of Iceland and Norway with the exotic energy of Thailand and Vietnam, showing you how to travel authentically, with passion and a camera in hand.



 ASIA